Wednesday, February 28, 2018

Unit 2: unemployment

Unemployment- the failure to use available resources, particularly labor, to produce desire goods and services
population- number of people in a country
labor force- number of people in a country that are classified as either employed or unemployed

groups 
employed: 16 years of age or older and has a job
must work at least one hour every two weeks

unemployed: 16 years of age or older that does not have a job, but have actively searched for a job in the last two weeks

not in labor force

  • kids, full- time students
  • institutionalized ( mental institutions) 
  • incarcerated ( prison)
  • disabled 
  • retirings
  • military personnel 
  •  stay at homes
  • discouraged workers ( failed to look for a a job) 

Unemployment Rate Formula
# Unemployed
________________ *100

Total Labor Force

4 Types

Frictional Unemployment

-temporarily unemployed or ( in between jobs)
- qualified workers with transferable skills
Structural Unemployment

-changes in the structure of the labor force makes some skills obsolete
-no transferrable skills
-jobs will not come back
-creative destruction
-jobs created, other jobs destroyed
ex: VCR repairmen
Seasonal Unemployment

-due to time of the year
ex: lifeguards, bus drivers
Cyclical Unemployment

-unemployment that results from economic downturns such as depression
-as demand for goods and services fall, demand for labor falls and workers are laid off

full employment
4 to 5% unemployment
if there is no cyclical unemployment 

NRU ( natural rate of unemployment) frictional + structural employment

Okun's law- when unemployment increases by one percent above the natural rate of unemployment. then GDP falls by 2%

Rule of 70- the number of years that is required for GDP to double


unit 2: inflation

Inflation
General rise in the price level
-reduce the purchasing power of money

Amount of goods and services that money buys.


Three causes

1.government Printing too much money.
( hyper inflation- govt that keeps printing money to pay debt)
2.Demand-Pull inflation : too many dollars chasing too few goods
pull up prices
3.Cost-Push inflation: higher production cost increase in prices


Ideal Inflation
Ideal inflation rate is from 2% to 3%.


Inflation Formula

Current Year Price Index - Previous Year Price Index
___________________________________________ * 100
Previous Year Price Index


Deflation
A decline in the general price level.


Real Interest Rate
Amount of money that is borrowed.
Percent increase in purchasing power that a borrower pays to the lender (adjusted for inflation)


=Nominal Interest Rate - Expected inflation


Nominal Interest Rate
The percent increase in money that the borrower pays back to the lender not adjusting for inflation.


unexpected inflation
Hurt by Inflation

  • Lenders- People who lend money (at fixed interest rates)
  • People with fixed incomes
  • Savers

Helped by Inflation

  • Borrowers- People who borrow money
  • A business where the price of the product increases faster than the price of resources.

unit 2: real and nominal GDP

Nominal GDP- it is the value of outputs produced in current year prices
formula: P x Q

can increase from year to year if either output increases or prices increases

Real GDP- it is the true value of output produced in constant base year prices that is adjusted for inflation
formula: base year of the P x Q

can increase from year to year only if output increases

Base year- in the base year, current prices is equal to constant prices
base year= nominal GDP = Real GDP


  • after: in years after the base year nominal GDP exceeds real GDP 
  • before: in years before the base year real GDP exceeds nominal GDP 
GDP Deflator- a price index used to adjust from nominal GDP to real GDP in the base year, the GDP deflator = 100

for years after base year > 100
for years before base year < 100 

formula: new-old/ old x 100


Consumer Price Index
Measures inflation by tracking changes in the price fo a market basket of goods.


= Price of the market basket of goods in the current year
______________________________________________*100


Price of the market basket of goods in the Base year

calculate GDP

Expenditure Approach to GDP:
C+Ig+G+Xn


Xn=Exports - Imports


Income Approach to GDP:


Wages(Compensation of employees/salaries)
+
Rents(Income received by the households and businesses that supply property resources)
+
Interests(Money paid by private businesses to the suppliers of loans)
+
profits.
+
Statistical Adjustments


Net Domestic Product
GDP - Depreciation


Net National Product
GNP - Depreciation

DEPRECIATION= consumption of fixed capital


Gross Private Domestic Investment
Net private Domestic Investment


GNP
GDP + Net Foreign Factor Payment

Tuesday, February 27, 2018

Unit 2: GDP

GDP: ( gross domestic product) total market value of all final goods and services produced within a country's borders within a given year
  • Includes all production or income earned
  • Excludes production outside of the U.S. even by Americans.


GNP: ( gross national product) A measure of what its citizens produce and whether they produce these items within its borders
  • Includes production or income earned by Americans anywhere in the world.
  • Excludes production by non-Americans even in the U.S.
Formula for GDP= C + Ig + G + Xn

Consumption=67%
Gross Private Domestic investment=18%
Government Purchases=17%
Net Exports=-2%

Included in GDP: 
C + Ig + G + Xn

Excluded in GDP: 
  • Intermediate Goods- Inputs used to make final goods in order to prevent double or multiple counting.
  • Used or second-hand goods
  • Stocks/Bonds ( financial transaction, no output being produced) 
  • Unreported business activity("tips") 
  • Gifts and Transfer Payments [ public or private] :( no output, recipients contributes to nothing)
  • Illegal Activities ( drugs) 
  • Non-Market activities

Unit 2: circular flow model


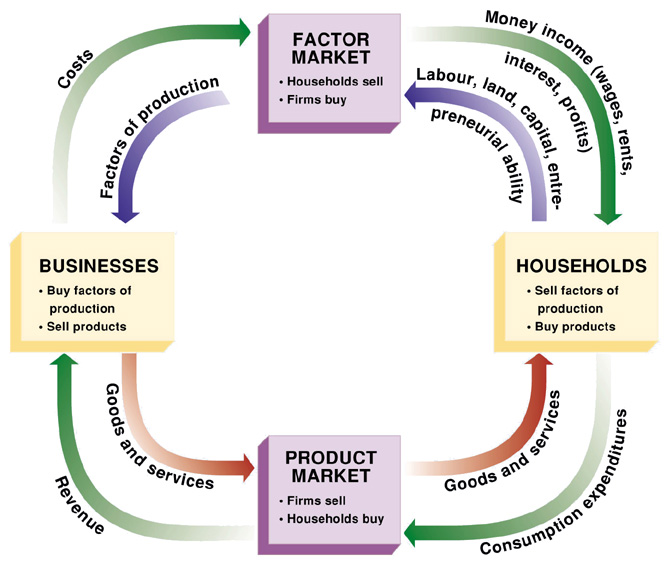
Circular Flow Model:
It represents the transactions in an economy by flows around a circle.


Household:
A person or group of people that share an income.


Business/Firm:
An organization that produces goods and services for sale.

Factor( resource) market:
this is the market where factor of production are sold
- bought by firms sold by household

Product market: 
market in which goods and services are bought and sold

Sunday, February 4, 2018

Price elasticity of demand

Elasticity of demand-A measure of how consumers will react to a change in price 

Inelastic demand [needs]- the demand for a good will not change, or will change very little regardless of price (few or no substitutes) ex: water, gas 
If required to calculate (E < 1) 

Elastic demand [wants]- demand will change greatly given a small change in price Ex: soda, dress, luxury food  
If required to calculate (E > 1) 
Unitary demand- (E=1)  

Total revenue= price times quantity [always must have dollar sign]  


calculating the price elasticity of demand 

Quantity 
- new minus old quantity divided by old quantity 

Price
- new minus old price divided by old price 

               Î”%  in price

Δ% in Quantity demanded
  Δ% in Price

supply and demand

Demand: 
The quantities that people are willing and able to buy at various prices.

The Law of Demand:
There is an inverse relationship between price and quantity demanded.
  • If one increases, the other one decreases.
what causes a " change in quantity of demanded"?
Δ in price

what causes a change in demand? 

  • Δ in buyer's taste ( advertisement)
  • Δ in the number of buyers (population)
  • Δ in income ( normal v inferior goods)
  • Δ  in the price of related goods (complementary and substitute goods)
  • Δ in expectations

Supply: 
The quantities that producers or sellers are willing and able to produce/sell at various prices.

The Law of Supply:
There is a direct relationship between price and quantity supplied.


what causes a " change in quantity supplied"? 
Δ in price 

What causes a change in supply?
  • Δ in the number of sellers ( suppliers, producers)
  • Δ in the cost of production 
  • Δ in technology 
  • Δ in weather 
  • Δ in taxes or subsidies
  • Δ in expectations
Excess Demand: 
Quantity demanded is greater than quantity supplied. (QD>QS)
  • Results in a shortage. 
  • Where consumers cannot get the quantities or items they desire.


Price Ceiling:
Creates shortages. 
  • (Found below the equilibrium point)
Price floors
legal minimum price meant to help sellers


Equilibrium Point:
This is the point at which the supply curve and the demand curve intersect.

factors of production


There are four factors of productions 
  • Land 
  • Labor 
  • Entrepreneurship 
  • Capital 
-  Land 
  • Natural resources 
- Labor 
  • Work exerted 
- Entrepreneurship  
  • Risk taker and innovative 
- Capital 
  • Human- knowledge and skill a worker gains through education, experiences 
  • Physical- human made objects used to create other goods/ services 
Opportunity cost- the next best alternative that you must give up in order to get something (a form of trade off) 
Law of increasing opportunity cost-  as you produce more of one good, the opportunity cost (the far-going production of another good) will increase 
Efficiency: using resources in such a way to maximize the production of goods or services (profit increase) 
trade offs- most preferred possible alternatives
Productions Possibility Curve:
This graph shows alternative ways to use an economy's resources.


Friday, February 2, 2018

Economics Beginnings


Macro vs. Micro economics 
Marco economics: The study of the economy as a whole  
Micro Economics: study of individuals, households and firms' behavior in decision making and allocation of resources. 
Needs vs. Wants 
Needs: Basic requirements for survival  
  • Food, water, shelter, clothes 
Wants: desires of the citizens 
  • Luxury clothes, brands 
Scarcity vs. Shortages and surplus 
Scarcitythe fundamental economic problem of having seemingly unlimited human wants and needs in a world of limited resources.  
Shortages: Where quantity demanded exceeds quantity supplied 
Quantity demanded > quantity supplies (raise price)  
Surplus: Quantity demanded < quantity supplies (lowers price) 
Positive Vs. Normative 
Positive economics: Claims that attempts to describe the world as is 
  • Very descriptive 
Normative economics: claims that attempt to describe how the world should be  
  • Ex: government should... 
Goods vs. Services 
Goods: tangible commodities, material that satisfy human wants and provide utility to consumer making a purchase 
Services: work perform for someone 
  • Nail salon, hair salon 

absolute vs comparative, input vs output

Specialization Individuals and countries can be made better off if they will produce in what they have a comparative advantage and then t...