- Money Creation Formula:
- A single bank can create $ by amount of its ER
- banking system as a whole can create $ by a multiple of excess reserves
- MM X ER = Expansion of $
- Money multiplier= 1/RR
- New vs. Existing Money:
- Initial deposit in a bank comes from the FED/bank purchase of a bond or other $ out of circulation (buried treasure), the deposit immediately increases the $ supply
- The deposit then leads to further expansion of the money supply through the money creation process.
- New Money Formula:
- Total change in MS if the initial deposit is new money:
- Deposit + Money created by the banking system.
- Existing Currency deposited into a checking account will only change the composition of the money supply.
- Total change in MS if the initial deposit is existing money:
- Banking system created money only
Saturday, April 28, 2018
money creation
unit 4: monetary policy

Expansionary - Recession and Easy $
- OMO ( open market operation) - buy bonds
- Reserve Requirement - ↓
- Discount Rate - ↓
- Bank Reserves - ↑
- Money Supply - ↑
- Fed Fund Rate - ↓
- DM - ↓
- i - ↓
- Ig - ↑
- AD - ↑
- GDPr - ↑
- Value of $ - ↓
- OMO - sell bonds
- Reserve Requirement - ↑
- Discount Rate - ↑
- Bank Reserves - ↓
- Money Supply - ↓
- Fed Fund Rate - ↑
- DM - ↑
- Ig - ↓
- AD - ↓
- GDPr - ↓
- Value of $ - ↑
Sunday, April 1, 2018
Fiscal Policy
fiscal policy
-changes in the expenditures or tax revenues of the federal government
government must borrow money when it runs a budget deficit
-changes in the expenditures or tax revenues of the federal government
- 2 tools of fiscal policy
- taxes- government can increase or decrease taxes
- spending- government can increase or decrease spending
fiscal policies is enacted to promote our nation's economic goal: full employment, price stability, economic growth
[ deficits, surpluses, and debt]
- balanced budget
- revenues= expenditures
- budget deficit
- revenues < expenditures
- budget surplus
- revenues > expenditures
- government debt
- sum of all deficits- sum or all surplus
- borrows from
- individuals
- corporations
- financial institutions
- foreign entities or government
FISCAL POLICY TWO OPTIONS
- discretionary fiscal policy (actions)
- expansionary fiscal policy- think deficit
- contractionary fiscal policy- think surplus
- non- discretionary fiscal policy ( no action)
Multiplier
The spending multiplier effect
- an initial change in spending ( C. IG. G. Xn) causes a larger change in aggregate spending, or aggregate demand (AD)
- multiplier= change in AD/ change in spending
- Δ in AD/ Δ ( C. IG. G. Xn)
why does this happen?
- expenditures and income flow continuously which sets off a spending increase in an economy
Calculating the spending multiplier
- the spending from the multiplier can be calculated from the MPC or the MPS
- multiplier= 1/1 . MPC or 1/ MPS
- multiplier are (+) when there is an increase in spending and (-) when there is a decrease
Calculating tax multiplier
When government taxes, multiplier works in reverse. This is because money is leaving the circular flow.
- tax multiplier( note: is negative)
Tax Multiplier = -MPC
_______
MPS
- if there is a tax cut then the multiplier is (+), because there is now more money in the circular flow
consumption/ savings

- Disposable Income
- Income after taxes or net income
- DI=Gross Income - Taxes
- Either save or spend, cannot do both equally.
- Consumption
- Household spending, the ability is constrained by the amount of DI and the propensity to save.
- Autonomous Consumption
- Households consuming when DI=0
- Dis-saving
- Saving
- Household not spending
- The ability to save is constrained by the amount of DI and the propensity to consume.
- Households DO NOT save when DI=0
- APC and APS
- APC + APS = 1
- APC > 1 = Dissaving, -APS = Dissaving
- APS = S / DI = %DI not spent
- APC = C / DI = % DI
- MPC and MPS
- MPC + MPS = 1
- ΔC / ΔDI = Marginal Propensity to Consume
- ΔS / ΔDI = Marginal Propensity to Save
- Determinants of Consumption and Saving
- Wealth
- Expectations
- Household Debt
- Taxes
AS/ AD model
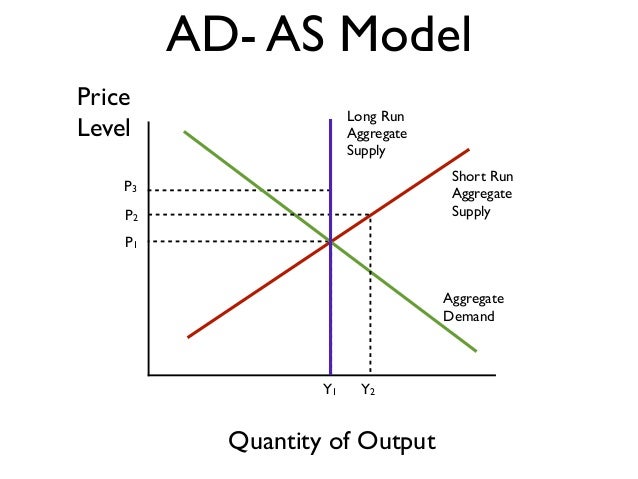
Full employment
- full employment equilibrium exists where AD intersects SRAS and LRAS at the same point
recessionary Gap
- a recessionary gap exists when equilibrium occurs below full employment output
inflationary Gap
- an inflationary gap exists when equilibrium occurs beyond full employment output
- n%
Aggregate Supply
aggregate supply curve

Aggregate supply long run VS short run
Cost of Capital
Raw Materials
Monopolies and cartels that control resources control the price of those resources.
Increase in Resource Prices = SRAS <----
Decrease in Resource Prices = SRAS ---->
Deregulation of resources compliance costs = SRAS --->
Aggregate supply long run VS short run
- the level of real GDP ( GDPr) that firms will produce at each price level ( PL)
long run: period of time where input prices are completely flexible and adjust to changes in the price level
- in the long run, the level of real GDP supplied is independent of the price level
short run: period of time where input prices are sticky and do not adjust to the changes in the price level
- in the short run, the level of real GDP supplied is directly related to the price level
Long run aggregate supply ( LRAS)
- the long run aggregate supply or the LRAS marks the level of full employment in the economy ( analogous to the PPC)
Short run aggregate supply (SRAS)
- because input prices are sticky in the short run, the SRAS is upward slopping
- an increase in SRAS is seen as a shift to the right
- a decrease in SRAS is seen as a shift to the left
Formula -> Total input cost/ total output
determinants of SRAS
- 1. Input Prices
Cost of Capital
Raw Materials
- Foreign Resource Prices
Monopolies and cartels that control resources control the price of those resources.
Increase in Resource Prices = SRAS <----
Decrease in Resource Prices = SRAS ---->
- 2. Productivity = Total Outputs / Total Inputs
- 3. Legal-Institutionoal Environment= Taxes and Subsidies, Taxes on Business
Deregulation of resources compliance costs = SRAS --->
UNIT 3: Aggregate Demand Curve
Aggregate Demand Curve

- AD is the demand by consumers, businesses, government, and foreign nations
- changes in price level causes a move along the curve not the shift of the curve
- shows the amount of real GDP that the private, public and foreign sector collectively desire to purchase at each possible price level
- relationship between price level and level of real GDP is inverse
why AD is downward sloping
wealth effect, interest rate effect, foreign trade effect
Four Determinants:
- Change in Consumer Spending:
- Consumer Wealth
- Consumer Expectations
- Household Indebtedness
- Taxes
- Change in Investment Spending:
- Real Interest Rate
- Future Business Expectations
- Productivity and Technology
- Business Taxes
- Change in Government Spending:
- More; AD shifts right
- Less; AD shifts left
- Change in Net Exports:
- Exchange Rates
- National Income Compared to Abroad
AD Formula:
C+Ig+G+Xn
Government Spending:
More Government Spending= Increase in AD = Rightward Shift
Less Government Spending = Decrease in AD = Leftward Shift
Subscribe to:
Comments (Atom)
absolute vs comparative, input vs output
Specialization Individuals and countries can be made better off if they will produce in what they have a comparative advantage and then t...
-
Phillips Curve There is an inverse relationship between inflation and unemployment. Each point on the Phillip's Curve correspon...
-
E lasticity of demand-A measure of how consumers will react to a change in price I nelastic demand [needs] - the demand for a goo...
