- Specialization
- Individuals and countries can be made better off if they will produce in what they have a comparative advantage and then trade with others for whatever else they require
- Absolute and Comparative Advantage
- Absolute Advantage
- The producer that can produce the most output or requires the least amount of inputs
- Comparative Advantage
- The producer with the lowest opportunity cost
- Input vs. Output
- Output shows the data as products produced given a set of resources.
- Outcome, result.
- Input shows the data as amount of resources needed to produce a fixed amount of output
- Time.
Friday, May 18, 2018
absolute vs comparative, input vs output
balance payment
- Balance of payments
- A measure of money inflows as well as outflows in the U.S. and the world.
- Three Accounts
- Current Account:
- Net Exports
- Exports give credit
- Imports give debit
- Net Foreign Income
- Income that is earned by foreign assets.
- Net Transfers
- Foreign aid
- Capital Account:
- This is the balance of capital ownership.
- Investments in the U.S.
- Purchase of financial assets by the foreigners.
- Official Reserves:
- Foreign currency holdings given by the Federal Reserve System.
- Balance of Goods and Services
- Goods exports +|- services exports - (goods imports + service imports)
- Balance on Current account
- Balance of good= services + net investment + net transfers.
- Official Reserves
- Current account + Capital Account = 0
Phillip's curve
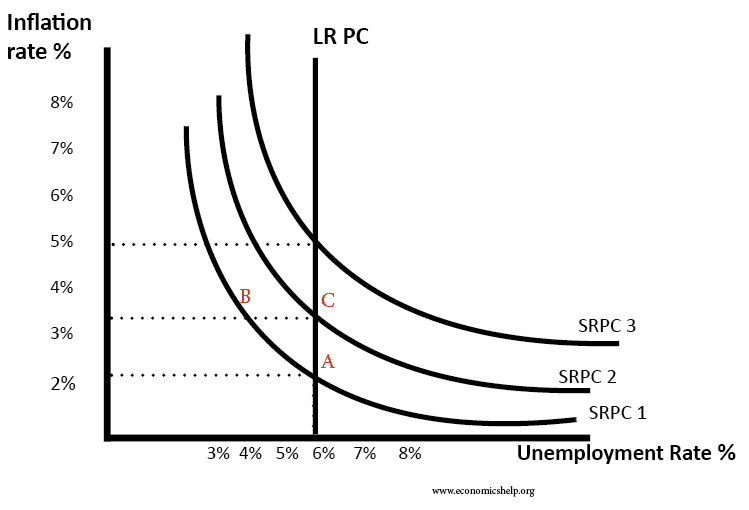
- Phillips Curve
- There is an inverse relationship between inflation and unemployment. Each point on the Phillip's Curve corresponds to a different level of output.
- Long Run
- Occurs at the natural rate of unemployment.
- It is represented by a vertical line.
- LRPC
- Long Run Phillips Curve will only shift if the LRAS shifts.
- Unemployment
- NRU is equal to frictional, seasonal, and structural unemployment.
- Short Run
- Since wages are sticky, inflation changes move the point on the SRPC.
- If inflation persists, then the entire SRPC moves up.
- Stagflation
- Unemployment and inflation simultaneously rise.
- Supply Shocks
- Rapid and significant increases in resource cost.
- If inflation expectations drop due to new technology or efficiency, then the SRPC will move downward.
- Misery Index
- Combination of inflation and unemployment in any given year.
Saturday, April 28, 2018
money creation
- Money Creation Formula:
- A single bank can create $ by amount of its ER
- banking system as a whole can create $ by a multiple of excess reserves
- MM X ER = Expansion of $
- Money multiplier= 1/RR
- New vs. Existing Money:
- Initial deposit in a bank comes from the FED/bank purchase of a bond or other $ out of circulation (buried treasure), the deposit immediately increases the $ supply
- The deposit then leads to further expansion of the money supply through the money creation process.
- New Money Formula:
- Total change in MS if the initial deposit is new money:
- Deposit + Money created by the banking system.
- Existing Currency deposited into a checking account will only change the composition of the money supply.
- Total change in MS if the initial deposit is existing money:
- Banking system created money only
unit 4: monetary policy

Expansionary - Recession and Easy $
- OMO ( open market operation) - buy bonds
- Reserve Requirement - ↓
- Discount Rate - ↓
- Bank Reserves - ↑
- Money Supply - ↑
- Fed Fund Rate - ↓
- DM - ↓
- i - ↓
- Ig - ↑
- AD - ↑
- GDPr - ↑
- Value of $ - ↓
- OMO - sell bonds
- Reserve Requirement - ↑
- Discount Rate - ↑
- Bank Reserves - ↓
- Money Supply - ↓
- Fed Fund Rate - ↑
- DM - ↑
- Ig - ↓
- AD - ↓
- GDPr - ↓
- Value of $ - ↑
Sunday, April 1, 2018
Fiscal Policy
fiscal policy
-changes in the expenditures or tax revenues of the federal government
government must borrow money when it runs a budget deficit
-changes in the expenditures or tax revenues of the federal government
- 2 tools of fiscal policy
- taxes- government can increase or decrease taxes
- spending- government can increase or decrease spending
fiscal policies is enacted to promote our nation's economic goal: full employment, price stability, economic growth
[ deficits, surpluses, and debt]
- balanced budget
- revenues= expenditures
- budget deficit
- revenues < expenditures
- budget surplus
- revenues > expenditures
- government debt
- sum of all deficits- sum or all surplus
- borrows from
- individuals
- corporations
- financial institutions
- foreign entities or government
FISCAL POLICY TWO OPTIONS
- discretionary fiscal policy (actions)
- expansionary fiscal policy- think deficit
- contractionary fiscal policy- think surplus
- non- discretionary fiscal policy ( no action)
Multiplier
The spending multiplier effect
- an initial change in spending ( C. IG. G. Xn) causes a larger change in aggregate spending, or aggregate demand (AD)
- multiplier= change in AD/ change in spending
- Δ in AD/ Δ ( C. IG. G. Xn)
why does this happen?
- expenditures and income flow continuously which sets off a spending increase in an economy
Calculating the spending multiplier
- the spending from the multiplier can be calculated from the MPC or the MPS
- multiplier= 1/1 . MPC or 1/ MPS
- multiplier are (+) when there is an increase in spending and (-) when there is a decrease
Calculating tax multiplier
When government taxes, multiplier works in reverse. This is because money is leaving the circular flow.
- tax multiplier( note: is negative)
Tax Multiplier = -MPC
_______
MPS
- if there is a tax cut then the multiplier is (+), because there is now more money in the circular flow
consumption/ savings

- Disposable Income
- Income after taxes or net income
- DI=Gross Income - Taxes
- Either save or spend, cannot do both equally.
- Consumption
- Household spending, the ability is constrained by the amount of DI and the propensity to save.
- Autonomous Consumption
- Households consuming when DI=0
- Dis-saving
- Saving
- Household not spending
- The ability to save is constrained by the amount of DI and the propensity to consume.
- Households DO NOT save when DI=0
- APC and APS
- APC + APS = 1
- APC > 1 = Dissaving, -APS = Dissaving
- APS = S / DI = %DI not spent
- APC = C / DI = % DI
- MPC and MPS
- MPC + MPS = 1
- ΔC / ΔDI = Marginal Propensity to Consume
- ΔS / ΔDI = Marginal Propensity to Save
- Determinants of Consumption and Saving
- Wealth
- Expectations
- Household Debt
- Taxes
AS/ AD model
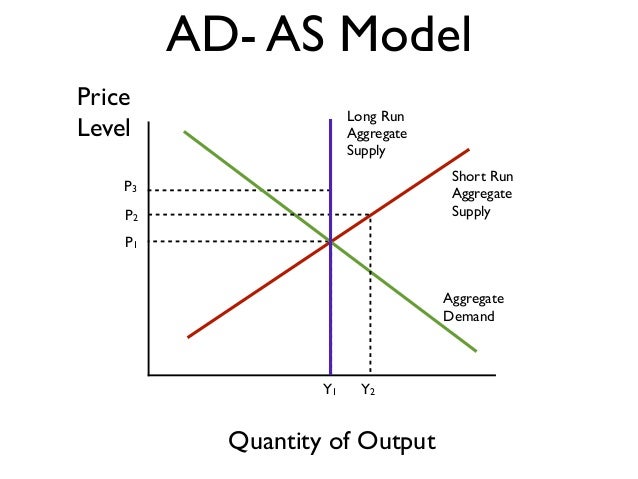
Full employment
- full employment equilibrium exists where AD intersects SRAS and LRAS at the same point
recessionary Gap
- a recessionary gap exists when equilibrium occurs below full employment output
inflationary Gap
- an inflationary gap exists when equilibrium occurs beyond full employment output
- n%
Aggregate Supply
aggregate supply curve

Aggregate supply long run VS short run
Cost of Capital
Raw Materials
Monopolies and cartels that control resources control the price of those resources.
Increase in Resource Prices = SRAS <----
Decrease in Resource Prices = SRAS ---->
Deregulation of resources compliance costs = SRAS --->
Aggregate supply long run VS short run
- the level of real GDP ( GDPr) that firms will produce at each price level ( PL)
long run: period of time where input prices are completely flexible and adjust to changes in the price level
- in the long run, the level of real GDP supplied is independent of the price level
short run: period of time where input prices are sticky and do not adjust to the changes in the price level
- in the short run, the level of real GDP supplied is directly related to the price level
Long run aggregate supply ( LRAS)
- the long run aggregate supply or the LRAS marks the level of full employment in the economy ( analogous to the PPC)
Short run aggregate supply (SRAS)
- because input prices are sticky in the short run, the SRAS is upward slopping
- an increase in SRAS is seen as a shift to the right
- a decrease in SRAS is seen as a shift to the left
Formula -> Total input cost/ total output
determinants of SRAS
- 1. Input Prices
Cost of Capital
Raw Materials
- Foreign Resource Prices
Monopolies and cartels that control resources control the price of those resources.
Increase in Resource Prices = SRAS <----
Decrease in Resource Prices = SRAS ---->
- 2. Productivity = Total Outputs / Total Inputs
- 3. Legal-Institutionoal Environment= Taxes and Subsidies, Taxes on Business
Deregulation of resources compliance costs = SRAS --->
UNIT 3: Aggregate Demand Curve
Aggregate Demand Curve

- AD is the demand by consumers, businesses, government, and foreign nations
- changes in price level causes a move along the curve not the shift of the curve
- shows the amount of real GDP that the private, public and foreign sector collectively desire to purchase at each possible price level
- relationship between price level and level of real GDP is inverse
why AD is downward sloping
wealth effect, interest rate effect, foreign trade effect
Four Determinants:
- Change in Consumer Spending:
- Consumer Wealth
- Consumer Expectations
- Household Indebtedness
- Taxes
- Change in Investment Spending:
- Real Interest Rate
- Future Business Expectations
- Productivity and Technology
- Business Taxes
- Change in Government Spending:
- More; AD shifts right
- Less; AD shifts left
- Change in Net Exports:
- Exchange Rates
- National Income Compared to Abroad
AD Formula:
C+Ig+G+Xn
Government Spending:
More Government Spending= Increase in AD = Rightward Shift
Less Government Spending = Decrease in AD = Leftward Shift
Wednesday, February 28, 2018
Unit 2: unemployment
Unemployment- the failure to use available resources, particularly labor, to produce desire goods and services
population- number of people in a country
labor force- number of people in a country that are classified as either employed or unemployed
groups
employed: 16 years of age or older and has a job
must work at least one hour every two weeks
unemployed: 16 years of age or older that does not have a job, but have actively searched for a job in the last two weeks
not in labor force
Unemployment Rate Formula
# Unemployed
________________ *100
Total Labor Force
4 Types
Frictional Unemployment
-temporarily unemployed or ( in between jobs)
- qualified workers with transferable skills
Structural Unemployment
-changes in the structure of the labor force makes some skills obsolete
-no transferrable skills
-jobs will not come back
-creative destruction
-jobs created, other jobs destroyed
ex: VCR repairmen
Seasonal Unemployment
-due to time of the year
ex: lifeguards, bus drivers
Cyclical Unemployment
-unemployment that results from economic downturns such as depression
-as demand for goods and services fall, demand for labor falls and workers are laid off
population- number of people in a country
labor force- number of people in a country that are classified as either employed or unemployed
groups
employed: 16 years of age or older and has a job
must work at least one hour every two weeks
unemployed: 16 years of age or older that does not have a job, but have actively searched for a job in the last two weeks
not in labor force
- kids, full- time students
- institutionalized ( mental institutions)
- incarcerated ( prison)
- disabled
- retirings
- military personnel
- stay at homes
- discouraged workers ( failed to look for a a job)
Unemployment Rate Formula
# Unemployed
________________ *100
Total Labor Force
Frictional Unemployment
-temporarily unemployed or ( in between jobs)
- qualified workers with transferable skills
Structural Unemployment
-changes in the structure of the labor force makes some skills obsolete
-no transferrable skills
-jobs will not come back
-creative destruction
-jobs created, other jobs destroyed
ex: VCR repairmen
Seasonal Unemployment
-due to time of the year
ex: lifeguards, bus drivers
Cyclical Unemployment
-unemployment that results from economic downturns such as depression
-as demand for goods and services fall, demand for labor falls and workers are laid off
full employment
4 to 5% unemployment
if there is no cyclical unemployment
NRU ( natural rate of unemployment) frictional + structural employment
Okun's law- when unemployment increases by one percent above the natural rate of unemployment. then GDP falls by 2%
Rule of 70- the number of years that is required for GDP to double
unit 2: inflation
Inflation
General rise in the price level
-reduce the purchasing power of money
Amount of goods and services that money buys.
Three causes
1.government Printing too much money.
Helped by Inflation
General rise in the price level
-reduce the purchasing power of money
Amount of goods and services that money buys.
Three causes
1.government Printing too much money.
( hyper inflation- govt that keeps printing money to pay debt)
2.Demand-Pull inflation : too many dollars chasing too few goods
2.Demand-Pull inflation : too many dollars chasing too few goods
pull up prices
3.Cost-Push inflation: higher production cost increase in prices
Ideal Inflation
Ideal inflation rate is from 2% to 3%.
Inflation Formula
Current Year Price Index - Previous Year Price Index
___________________________________________ * 100
Previous Year Price Index
Deflation
A decline in the general price level.
Real Interest Rate
Amount of money that is borrowed.
Percent increase in purchasing power that a borrower pays to the lender (adjusted for inflation)
=Nominal Interest Rate - Expected inflation
Nominal Interest Rate
The percent increase in money that the borrower pays back to the lender not adjusting for inflation.
unexpected inflation
Hurt by Inflation
- Lenders- People who lend money (at fixed interest rates)
- People with fixed incomes
- Savers
Helped by Inflation
- Borrowers- People who borrow money
- A business where the price of the product increases faster than the price of resources.
unit 2: real and nominal GDP
Nominal GDP- it is the value of outputs produced in current year prices
formula: P x Q
can increase from year to year if either output increases or prices increases
Real GDP- it is the true value of output produced in constant base year prices that is adjusted for inflation
formula: base year of the P x Q
can increase from year to year only if output increases
Base year- in the base year, current prices is equal to constant prices
base year= nominal GDP = Real GDP
Consumer Price Index
Measures inflation by tracking changes in the price fo a market basket of goods.
= Price of the market basket of goods in the current year
______________________________________________*100
Price of the market basket of goods in the Base year
formula: P x Q
can increase from year to year if either output increases or prices increases
Real GDP- it is the true value of output produced in constant base year prices that is adjusted for inflation
formula: base year of the P x Q
can increase from year to year only if output increases
Base year- in the base year, current prices is equal to constant prices
base year= nominal GDP = Real GDP
- after: in years after the base year nominal GDP exceeds real GDP
- before: in years before the base year real GDP exceeds nominal GDP
GDP Deflator- a price index used to adjust from nominal GDP to real GDP in the base year, the GDP deflator = 100
for years after base year > 100
for years before base year < 100
formula: new-old/ old x 100
Consumer Price Index
Measures inflation by tracking changes in the price fo a market basket of goods.
= Price of the market basket of goods in the current year
______________________________________________*100
Price of the market basket of goods in the Base year
calculate GDP
Expenditure Approach to GDP:
C+Ig+G+Xn
Xn=Exports - Imports
Income Approach to GDP:
Wages(Compensation of employees/salaries)
+
Rents(Income received by the households and businesses that supply property resources)
+
Interests(Money paid by private businesses to the suppliers of loans)
+
profits.
+
Statistical Adjustments
Net Domestic Product
GDP - Depreciation
Net National Product
GNP - Depreciation
DEPRECIATION= consumption of fixed capital
Gross Private Domestic Investment
Net private Domestic Investment
GNP
GDP + Net Foreign Factor Payment
Tuesday, February 27, 2018
Unit 2: GDP
GDP: ( gross domestic product) total market value of all final goods and services produced within a country's borders within a given year
- Includes all production or income earned
- Excludes production outside of the U.S. even by Americans.
GNP: ( gross national product) A measure of what its citizens produce and whether they produce these items within its borders
- Includes production or income earned by Americans anywhere in the world.
- Excludes production by non-Americans even in the U.S.
Formula for GDP= C + Ig + G + Xn
Consumption=67%
Gross Private Domestic investment=18%
Government Purchases=17%
Net Exports=-2%
Included in GDP:
C + Ig + G + Xn
C + Ig + G + Xn
Excluded in GDP:
- Intermediate Goods- Inputs used to make final goods in order to prevent double or multiple counting.
- Used or second-hand goods
- Stocks/Bonds ( financial transaction, no output being produced)
- Unreported business activity("tips")
- Gifts and Transfer Payments [ public or private] :( no output, recipients contributes to nothing)
- Illegal Activities ( drugs)
- Non-Market activities
Unit 2: circular flow model
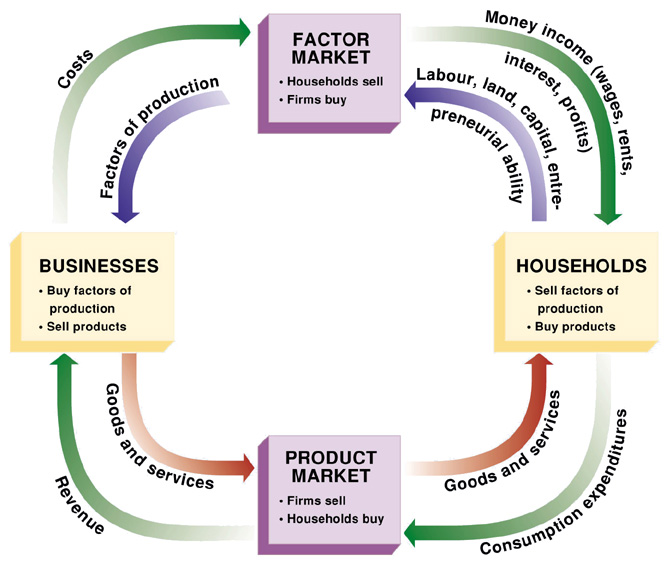
Circular Flow Model:
It represents the transactions in an economy by flows around a circle.
Household:
A person or group of people that share an income.
Business/Firm:
An organization that produces goods and services for sale.
Factor( resource) market:
this is the market where factor of production are sold
- bought by firms sold by household
Product market:
market in which goods and services are bought and sold
Sunday, February 4, 2018
Price elasticity of demand
Elasticity of demand-A measure of how consumers will react to a change in price
Inelastic demand [needs]- the demand for a good will not change, or will change very little regardless of price (few or no substitutes) ex: water, gas
If required to calculate (E < 1)
Elastic demand [wants]- demand will change greatly given a small change in price Ex: soda, dress, luxury food
If required to calculate (E > 1)
Unitary demand- (E=1)
Total revenue= price times quantity [always must have dollar sign]
calculating the price elasticity of demand
Quantity
- new minus old quantity divided by old quantity
Price
- new minus old price divided by old price
Δ% in price
Δ% in Quantity demanded
Δ% in Price
supply and demand
Demand:
The quantities that people are willing and able to buy at various prices.
The Law of Demand:
There is an inverse relationship between price and quantity demanded.
- If one increases, the other one decreases.
Δ in price
what causes a change in demand?
- Δ in buyer's taste ( advertisement)
- Δ in the number of buyers (population)
- Δ in income ( normal v inferior goods)
- Δ in the price of related goods (complementary and substitute goods)
- Δ in expectations
Supply:
The quantities that producers or sellers are willing and able to produce/sell at various prices.
The Law of Supply:
There is a direct relationship between price and quantity supplied.
what causes a " change in quantity supplied"?
Δ in price
What causes a change in supply?
- Δ in the number of sellers ( suppliers, producers)
- Δ in the cost of production
- Δ in technology
- Δ in weather
- Δ in taxes or subsidies
- Δ in expectations
Excess Demand:
Quantity demanded is greater than quantity supplied. (QD>QS)
- Results in a shortage.
- Where consumers cannot get the quantities or items they desire.
Price Ceiling:
Creates shortages.
- (Found below the equilibrium point)
Price floors
legal minimum price meant to help sellers
Equilibrium Point:
This is the point at which the supply curve and the demand curve intersect.
factors of production

There are four factors of productions
- Land
- Labor
- Entrepreneurship
- Capital
- Land
- Natural resources
- Labor
- Work exerted
- Entrepreneurship
- Risk taker and innovative
- Capital
- Human- knowledge and skill a worker gains through education, experiences
- Physical- human made objects used to create other goods/ services
Opportunity cost- the next best alternative that you must give up in order to get something (a form of trade off)
Law of increasing opportunity cost- as you produce more of one good, the opportunity cost (the far-going production of another good) will increase
Efficiency: using resources in such a way to maximize the production of goods or services (profit increase)
trade offs- most preferred possible alternatives
Productions Possibility Curve:
This graph shows alternative ways to use an economy's resources.
Subscribe to:
Posts (Atom)
absolute vs comparative, input vs output
Specialization Individuals and countries can be made better off if they will produce in what they have a comparative advantage and then t...
-
Phillips Curve There is an inverse relationship between inflation and unemployment. Each point on the Phillip's Curve correspon...
-
E lasticity of demand-A measure of how consumers will react to a change in price I nelastic demand [needs] - the demand for a goo...
